
When solving a problem, it’s easy to get lost in the process. As more variables are introduced, it can be hard to keep everything straight and predict where you’ll end up. This is especially prevalent in UX or service design projects where astute organization and accurate documentation mean the difference between an innovative solution and absolute failure.
To solve user needs, there are many different methods or techniques a team can employ to kickstart the design iteration process. Today, there are literally hundreds of methodologies to choose from. They could be as familiar as A/B testing or as foreign as the Elito Method. In this blog post, we will explore the Business Origami method and evaluate its usefulness in modern UX development.
What is this method?
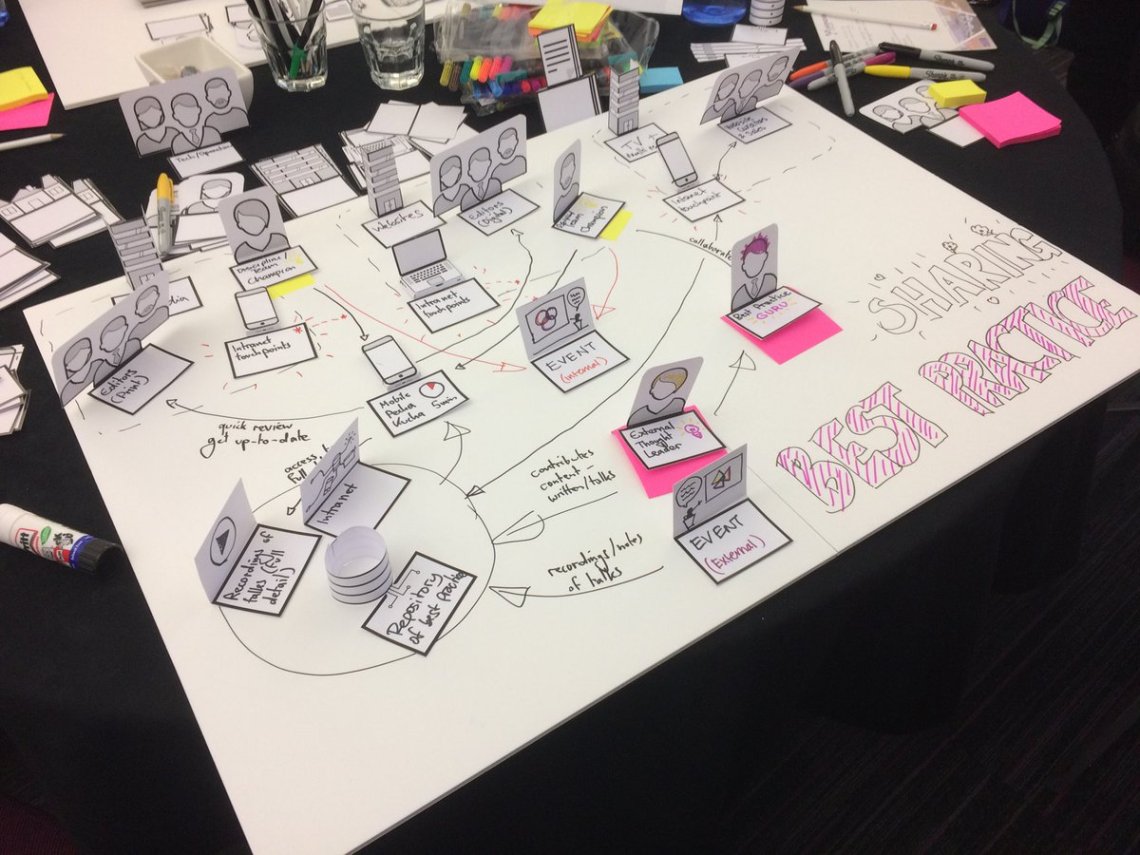
Developed in 2006 by Hitachi Design Center’s Yukinobu Maruyama, Business Origami is a method that uses paper cut-outs and other tangible objects as symbolic representations of different elements in a system to help document interactions (Jones). Designed to be low-budget, many UX professionals recommend Sharpies, Post-its, paper, scissors, and gluesticks as tools. The paper cut-out elements are meant to represent people, groups, channels, transactions, and environments. After the cut-outs are created, they are placed on a large environment, like a whiteboard or poster board, so that the interactions and flows of the system can be drawn around them.
Unlike other design methods, Business Origami is a quick and easy collaborative effort that can be used to understand end users, while supplementing finds from other qualitative research methods. By creating a map of the participants in a product’s environment, designers can generate empathy for the user groups and provide clarity about where pain points lie (Munoz, 2016). Because of its tangible, low-fidelity nature, the interactions of stakeholders can be noted and manipulated easily. Since its inception, organizations like Google, SAP, and IBM have since adopted this method into their in-house design process.
How do you use this method?
Using Business Origami is pretty straightforward. First, create and cut out the swath of elements you need in order to represent your system, labeling them accordingly so that each is easily identified. Afterward, find a place for all these pieces to live like a whiteboard or poster board (the canvas). To start the exercise, prompt your stakeholders/participants to draw relationships and service flows between each of the elements. It’s helpful to use different colors to help keep different relationships easily identifiable. From here, participants will try to fulfill a goal the design team sets. This could be anything from purchasing a product or creating an account to messaging another user on the platform. Watch a typical session from this Italian firm as they try to enhance the experience at breast cancer screening clinics below.
According to Chenghan Ke’s Medium article, there are two processes (models) that participants must go through in order to effectively use the Business Origami method to find problems and insights (Ke, 2019):
Current Model: This model focuses on building the current service model your company uses to help understand the existing pros and cons of the service.
Future Model: This model builds off of the findings found in the current model exercise. Participants will try to solve the problems uncovered in the previous round by adding new elements or editing some of the current services.
While executing the above models, it is recommended to document each step or change with notes and photography of the canvas so that the team has a detailed visual log of progressions and problems. A meaningful Business Origami workshop will take approximately 2-3 hours depending on the group size. (It is recommended to stay between 5 – 15 people.)
What are the benefits?
The main benefit of Business Origami is that it is heavily participatory and allows for rapid experimentation. By creating a shared mental model of an existing system, it becomes easier to explore new possibilities for solutions and simplifications. IBM User Researcher David Munoz states that stakeholders’ direct input helps to create empathy for the end users, which is crucial for creating alignment between the design, development, and product management teams (Munoz, 2016).
Where has it been used?
While it is extremely difficult to find actual research studies that used Business Origami, I managed to uncover a great example in the book Studying and Designing Technology for Domestic Life: Lessons from Home.
In Chapter 6, authors Tejinder K. Judge and Carman Neustaedter describe how they used the technique to improve the Google Fiber service. Google Fiber is a broadband internet and TV service that is currently testing in several locations in the United States. The vision of this product offering was to remove the frustrations of traditional internet experiences and allow for a more connected digital ecosystem.
To understand how families were using Google Fiber, Judge and Neustaedter employed the Business Origami technique to map how each family member in the household used the internet. Over a period of a year, the Business Origami technique was used to track households’ behavioral changes. Google representatives would visit each customer and have them complete the exercise. After discovering that for many customers it was inconvenient to have to remember rules, tokens, and set aside time in their busy schedules, Google decided to digitize the process.
Although digitizing the process did take away some of the charm and kinesthetic gameplay, they found that it did wonders for the longevity of the maps and participant retention (Judge & Neustaedter, 2015). They could more easily see changes, recreate boards, and archive previous sessions. But, as one can imagine, there were some unforeseen challenges regarding technology as many participants had some sort of issue trying to complete the exercise or simply were not technologically savvy enough to partake without needing in-depth tutorials.
Overall, the Google Fiber team was very satisfied with the results from the Business Origami method and how it was able to help them document the subtle changes within each user throughout the year. They cite it as a light-weight way of gathering data that does not overburden participants and recommend it to any team looking for a quick and easy way to understand complex ecosystems and behavioral changes over time (Judge & Neustaedter, 2015).
Would you use Business Origami in your next UX or service design project? Let me know in the comments below.
Works Cited:
Jones, R. (n.d.). Business Origami. Retrieved March 29, 2020, from https://www.service-design-network.org/community-knowledge/business-origami
Judge, T., & Neustaedter, C. (2015). Studying and designing technology for domestic life: lessons from home. Waltham, MA: Morgan Kaufmann.
Ke, C. (2019, September 3). Business Origami: A Method For Service Design. Retrieved March 29, 2020, from https://medium.com/@hankkechenghan/business-origami-valuable-method-for-service-design-43a882880627
Munoz, D. (2016, July). Business Origami: Learning, Empathizing, and Building with Users User Experience Magazine. Retrieved March 29, 2020, from https://uxpamagazine.org/business-origami/

1 comment