I’ve always marveled at people’s ability to create power out of letters. By itself, the English alphabet consists of 26 letters – 21 consonant letters, 5 vowels – but the combination of them yields over 170 thousand words. As language changes throughout time, words are added or deemed obsolete. Through the power of social media, people can communicate every one of their words on a global scale – instantaneously. As these words hold omnipotent power, it is important for businesses to understand what people are saying and use these insights to their advantage.
This practice is called social media text analytics. By running comments, reviews, and posts through text analytics tools, a social media team is able to gain big-picture statistics as well as granular learnings that can be used to determine brand equity and performance against competitors. Simply reading all of the textual engagement your brand receives isn’t feasible, and trying to extract value without a tool is near impossible. No one has the time to document each and every post into an Excel document while assigning nuanced variables to them – it’s an archaic practice anyway!
Now that we understand the value of social media text analytics, we have to know the difference between dynamic text and static text. Dynamic text is a user-generated statement that expresses an opinion on social media. These real-time updates are shorter in length and do not have much “staying power.” Statuses and comments are updated, deleted, and edited whenever the user has the whim to. Static text is more lengthy and is not edited/touched nearly as frequently – and when they are, it’s usually due to a critical update to the content or to fix egregious mistakes. These entries on social media or webpages are seen to have more credibility and can be used as primary sources.
As businesses look to extract value from mostly dynamic sources, text analysis tools get the job done efficiently and accurately. Through different types of analysis, businesses can begin to measure their audience’s sentiment, intention, stance, and even begin to predict (or create) trends that their followers will latch on to. Totally fascinating stuff, don’t you think?
Adobe Case Study
To provide an example of how text analytics and keywords can provide valuable insights, I’m going to take you through an exercise I did using Adobe as my subject. If you are a designer, creative, or social media guru, you know that Adobe and its Creative Cloud suite of products rules. There have been many knock-offs, like GIMP, and SASS programs, like Canva, that try to throw the OG creative program company off of its throne. As someone who uses Adobe products on the daily, I was interested to see if we could determine some business insights for their company based off of what we found on Twitter.
Using online social media management tool, Sprout Social, I used five keywords that strongly resonate with their business; their company name, graphic design, typography, branding, & UX design.
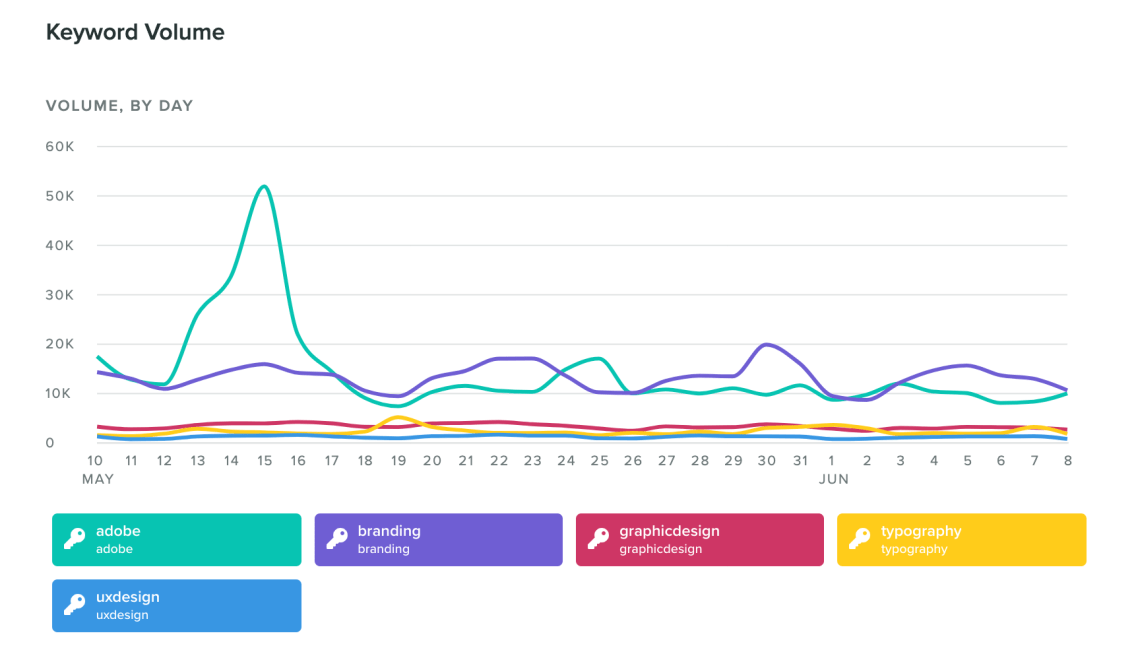
As you can see from the above chart, the keyword “Adobe” majorly outperformed compared to the other selected keywords. On the 15th and 16th of May, Adobe had an industry summit which most likely led to the major spike during that timeframe. What I thought was rather interesting was that “branding” majorly intertwined with the popularity of “Adobe.” It was surprising to me that the classifier keywords like “graphic design,” “typography,” and “UX design” weren’t as popular on Twitter.
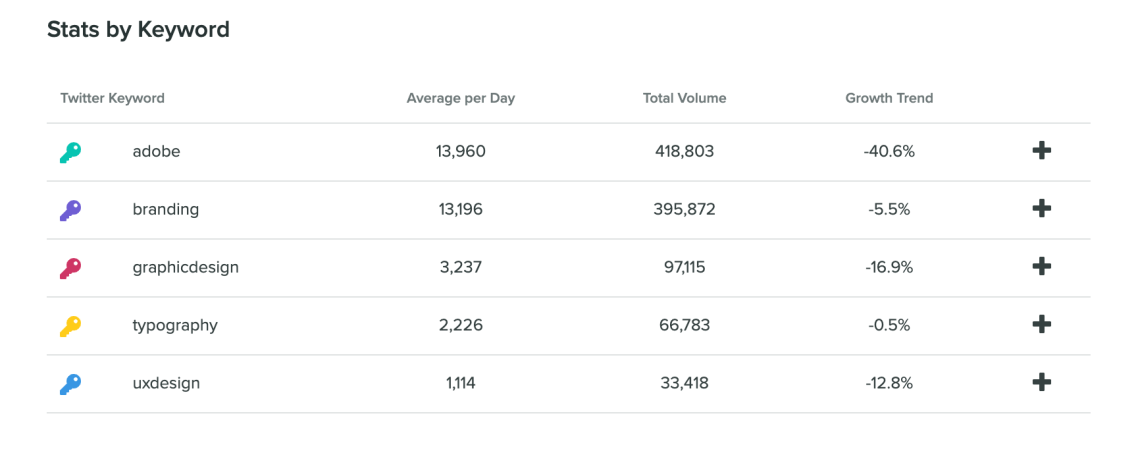
If we look at the volume of tweets, we can see a unique “funnel” effect that was totally a surprise. As the parent of the keywords, “Adobe” sits atop the list. From a business standpoint, it is extremely positive that your brand name outperforms the keywords that it supports. Because Adobe tools are almost exclusive to creating branded creative like marketing materials, websites, and more, it makes sense that “branding” is tucked right underneath “Adobe.” While this intertwined result is great, we cannot assume that all of the excitement with the keyword “branding” is directly correlated to “Adobe.” As we go down the list, we see the other three keywords – which are nearly all 33k apart in volume for the past month. This makes sense to me as “graphic design” encompasses both “typography” and “UX design.” UX design is rather niche compared two the other keywords so it being seated in the last position shows how many people are interested/understand/engage/relate with that topic.
After looking at the top tweets for all of the keywords, it seemed that many of them circled around influencers/creators that used an Adobe product to produce content for their tweet or were discussing trends within the diverse creative spheres. After looking at these keywords’ statistics, I believe that Adobe can extract a couple of learnings from these basic insights:
- Their name has unparalleled power: Out of all of the keywords tested, their brand name trumps all. They should make more of an effort to see how they can use their name to stir up change within the creative industry. Poignant marketing campaigns or unique contests can keep them fresh and top of mind.
- Branding is the boss: During the months of May and June, “branding” was a keyword that jumped out as a heavy-hitter. As any business knows, branding is important because it defines who you are to your customers and how you relate to your competitors. In the past couple of years, with competition like Canva, making it easy for non-designers to make creative, Adobe was losing a portion of its customers. After looking at how brands and users are now creating quick, eye-catching content, Adobe released Adobe Spark. This offering mimics the ability to upload a company’s brand elements into it to create great pieces of content – but it hasn’t really caught on in the design community. In an effort to get more people using it, Adobe personnel have been attending industry conferences to stir up the excitement. To leverage the high-interest and visibility of the keyword “branding,” Adobe might want to consider a social campaign that encourages brands to show what they’ve created for their business with Adobe Spark.
- They now know the golden ratio: From the charts above, we’ve found the breakdown of how their product offerings penetrate on social media. Programs used for typography like Adobe Illustrator likely are more popular than those used to create prototypes like Adobe XD. All-around basic design tools like Photoshop and InDesign might be the most popular because they cater specifically towards digital and print media, respectively, and are used to create a large share of graphic design posts. From this information, Adobe can see the pace at which they might need to put out program-specific content or where they should be thinking of the next big update.
Overall, I thought that this exercise was a fun way to see how businesses can use plain text to obtain meaningful business insights. If I were to do a second iteration of this exercise, I’d be curious to see how keywords “Adobe Spark,” “Adobe Photoshop,” “Adobe XD,” “Adobe InDesign,” and “Adobe Illustrator” relate to the parent “Adobe” keyword. This would show a clearer view of which of their products holds the market’s attention and which might be their most valuable offering.
Why do you think Adobe’s brand name is the most influential keyword out of those we tested today? Let me know in the comments below.
